
4.2. Model Description—Flowcharts
Figures 4 and 5 show the water flow of traditional RAS and one-loop aquaponic systems.
Whereas the outflow in RAS is mainly defined by water discharge rates and sludge removal, the
main outflow in one-loop aquaponic systems occurs via evapotranspiration and sludge removal.
Figure 6 illustrates in what DAPS differ from the other approaches. Although its main water outflow
is also defined through evapotranspiration, it reduces water loss by recycling the sludge, whose
production can kept stable by maintaining a constant fish biomass (Figure 7). It must be noted
that, as aquacultural sludges contain 95%–97% of water [32], the sludge remineralization process
also recycles the water back into the hydroponic component (Figure 8). Depending on the sizing
parameter and/or cultivation area, additional denitrification might be needed in the RAS in case the
evaporation-dependent water flow to the hydroponic component is not sufficient in order to maintain
required nitrate levels in the RAS.
Figures 4 and 5 show the water flow of traditional RAS and one-loop aquaponic systems.
Whereas the outflow in RAS is mainly defined by water discharge rates and sludge removal, the
main outflow in one-loop aquaponic systems occurs via evapotranspiration and sludge removal.
Figure 6 illustrates in what DAPS differ from the other approaches. Although its main water outflow
is also defined through evapotranspiration, it reduces water loss by recycling the sludge, whose
production can kept stable by maintaining a constant fish biomass (Figure 7). It must be noted
that, as aquacultural sludges contain 95%–97% of water [32], the sludge remineralization process
also recycles the water back into the hydroponic component (Figure 8). Depending on the sizing
parameter and/or cultivation area, additional denitrification might be needed in the RAS in case the
evaporation-dependent water flow to the hydroponic component is not sufficient in order to maintain
required nitrate levels in the RAS.
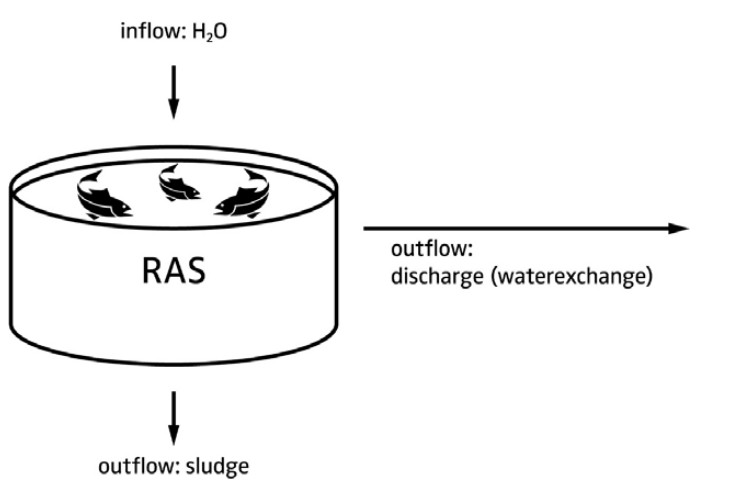
Figure 4. Water flow in a RAS system, whereas the tank represents the whole RAS system comprising
all parts of a RAS (this is also applicable to the following figures). In terms of sustainability, the water
use efficiency presents a drawback of this approach, as water is discharged to maintain an acceptable
water quality for the fish. This constitutes a waste of water and nutrient resources as well as nutrient
emissions. In addition, the nutrient-rich sludge often is not reused for fertilizing purposes, but instead
is discharged to the sewage system.
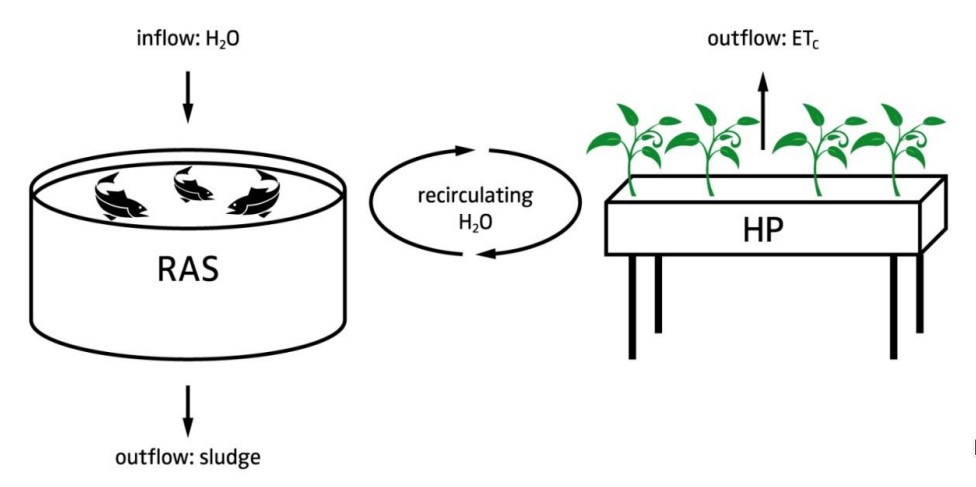 Figure 5. Water flow in a one-loop aquaponic system. This system approach provides the basis for
aquaponics. Unlike RAS, the nutrient-rich water is not discharged, but instead used for the fertilization
of a plant crop. Both components are exposed to similar water conditions. In one-loop systems the
water primarily leaves the system via the crop evapotranspiration (ETc) and the sludge. Minor water
loss can be seen in the integrated water flow chart in Figure 9.
all parts of a RAS (this is also applicable to the following figures). In terms of sustainability, the water
use efficiency presents a drawback of this approach, as water is discharged to maintain an acceptable
water quality for the fish. This constitutes a waste of water and nutrient resources as well as nutrient
emissions. In addition, the nutrient-rich sludge often is not reused for fertilizing purposes, but instead
is discharged to the sewage system.
Figure 5. Water flow in a one-loop aquaponic system. This system approach provides the basis foraquaponics. Unlike RAS, the nutrient-rich water is not discharged, but instead used for the fertilization
of a plant crop. Both components are exposed to similar water conditions. In one-loop systems the
water primarily leaves the system via the crop evapotranspiration (ETc) and the sludge. Minor water
loss can be seen in the integrated water flow chart in Figure 9.
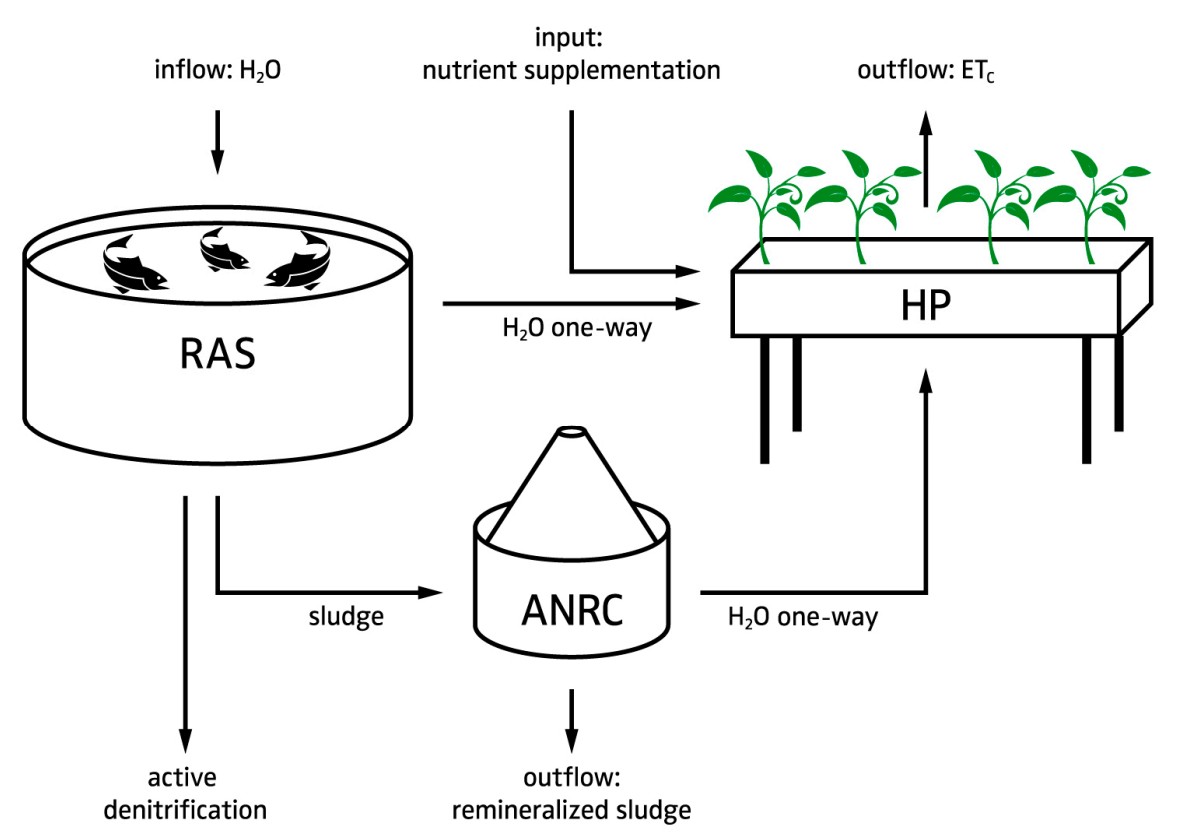
Figure 6. Water flow in a DAPS. As the ANRC is expected to remove most of the N, active denitrification
might be needed in the RAS to reduce the nitrate concentration. This is especially the case if the water
flow to the hydroponic component is not sufficient to keep the RAS water quality at a desired level.
The flow chart also shows other amendments to the one-loop aquaponic system approach: (1) an
ANRC that remineralizes the sludge and reduces water and fertilizer requirements; and (2) manual
nutrient supplementation and nutritious ANRC nutrient outflows provide the hydroponic component
with optimal nutrient concentrations that do not dilute in the whole system.
might be needed in the RAS to reduce the nitrate concentration. This is especially the case if the water
flow to the hydroponic component is not sufficient to keep the RAS water quality at a desired level.
The flow chart also shows other amendments to the one-loop aquaponic system approach: (1) an
ANRC that remineralizes the sludge and reduces water and fertilizer requirements; and (2) manual
nutrient supplementation and nutritious ANRC nutrient outflows provide the hydroponic component
with optimal nutrient concentrations that do not dilute in the whole system.
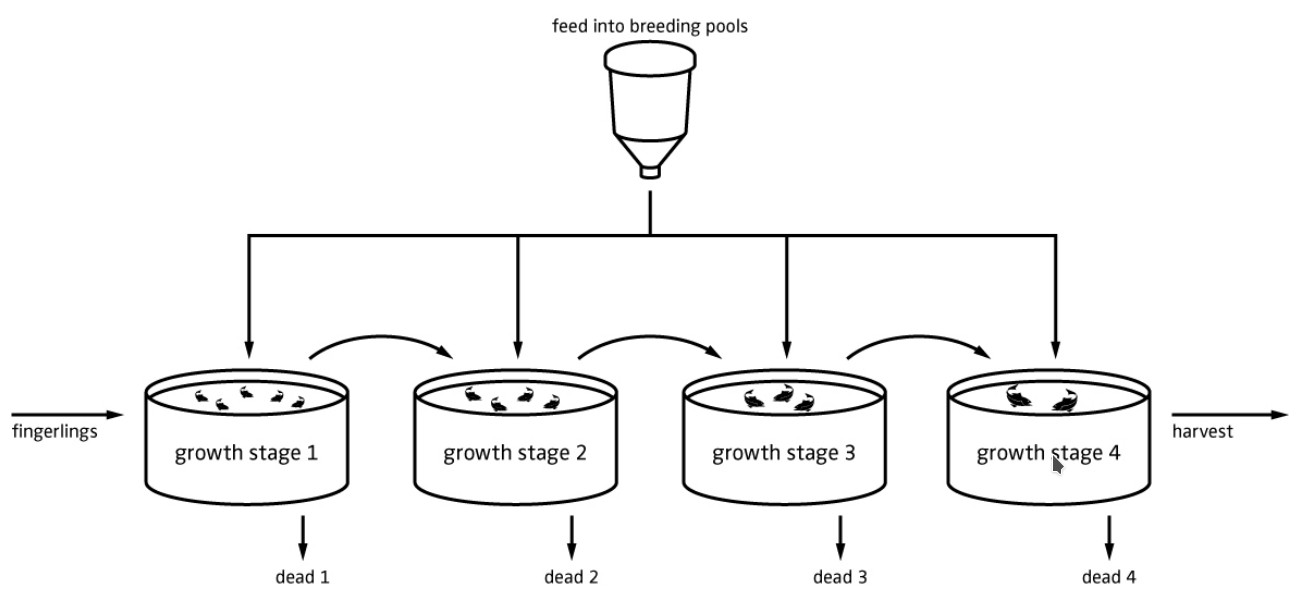
Figure 7. Fluctuation of the water composition is closely linked with the system’s nutrient input. As the
main input in aquaponic systems is fish feed, aquaponic systems should be running with fish of several
growth stages to ensure a close to constant uniform feed input to the system. The amount of fish does
not change drastically; different fish sizes were used for illustration purposes only
main input in aquaponic systems is fish feed, aquaponic systems should be running with fish of several
growth stages to ensure a close to constant uniform feed input to the system. The amount of fish does
not change drastically; different fish sizes were used for illustration purposes only
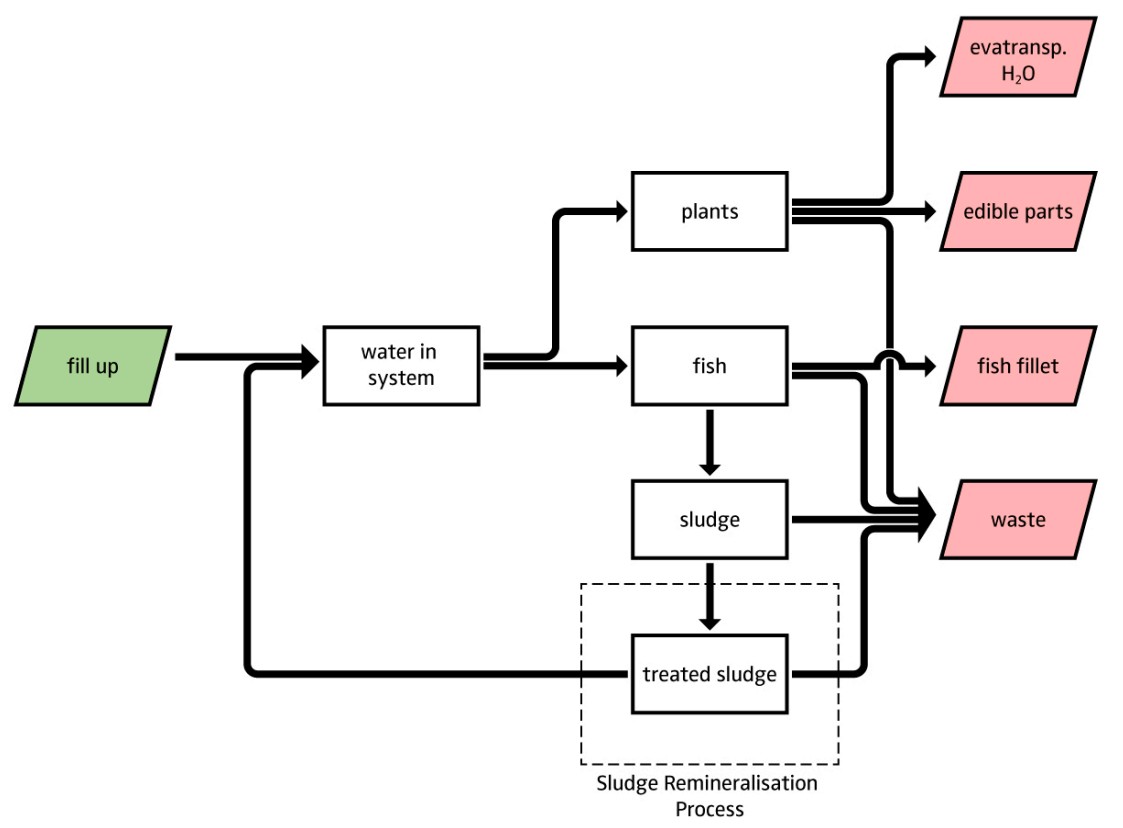
Figure 8. The water flow chart shows the water flows within a DAPS system. It can be seen, that
the implementation of an ANRC has an impact on the water availability in the system. Even though,
the water loss through evapotranspiration outweighs the loss through sludge removal, it is still an
important step towards closing the cycle.
the implementation of an ANRC has an impact on the water availability in the system. Even though,
the water loss through evapotranspiration outweighs the loss through sludge removal, it is still an
important step towards closing the cycle.
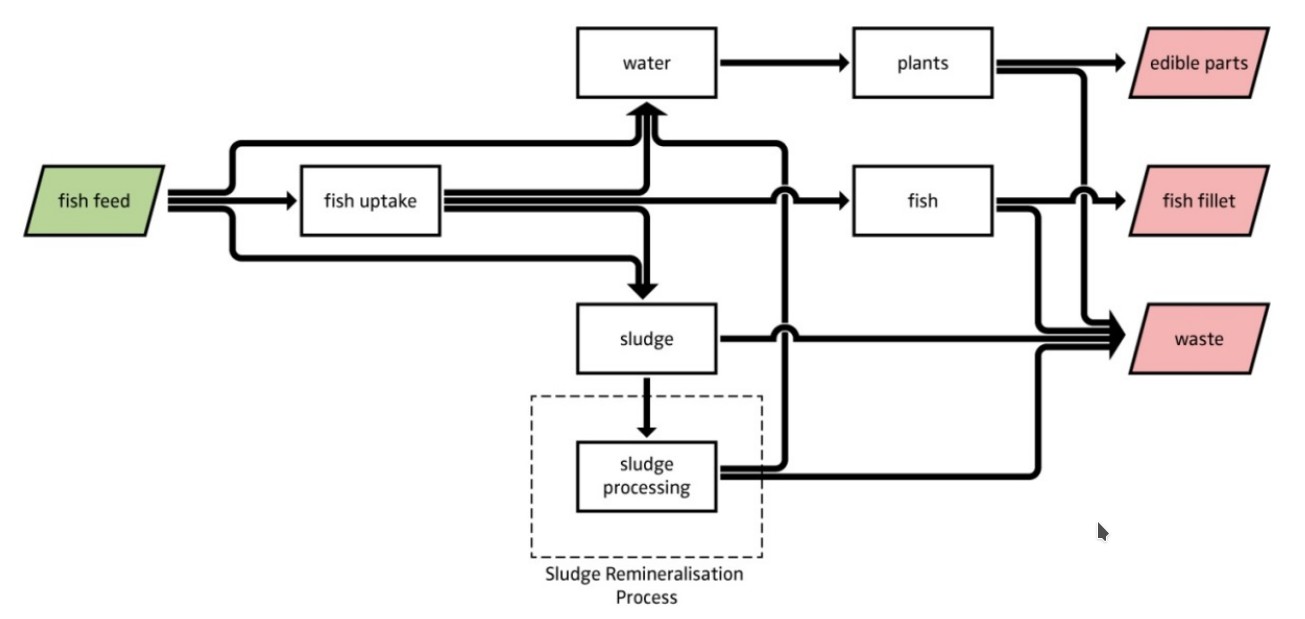
Figure 9. Flow chart for nutrients within a DAPS. The accumulation of nutrients can be allocated to
edible parts of the plants, edible parts of the fish (i.e., fish fillet) and waste. The dashed line shows the
impact of an ANRC on the nutrient flows. Recycled nutrients are added to the hydroponic water and
can accumulate in the plant tissues, while fish are not exposed to deleterious nutrient concentrations
in the water.
edible parts of the plants, edible parts of the fish (i.e., fish fillet) and waste. The dashed line shows the
impact of an ANRC on the nutrient flows. Recycled nutrients are added to the hydroponic water and
can accumulate in the plant tissues, while fish are not exposed to deleterious nutrient concentrations
in the water.
Following the sludge treatment approach (illustrated in Figures 8 and 9), the nutrient loss
drawbacks can be limited. Sludge produced by commercial RAS must undergo treatment
before disposal unless centralized waste treatment utilities are available [82]. Consequently, the
implementation of future-oriented recycling solutions should be considered when designing DAPSs
(Figure 6).
drawbacks can be limited. Sludge produced by commercial RAS must undergo treatment
before disposal unless centralized waste treatment utilities are available [82]. Consequently, the
implementation of future-oriented recycling solutions should be considered when designing DAPSs
(Figure 6).
5. Results
5.1. Fish Biomass Estimates
The DAPS model (see Figures A1–A4) outputs are shown in Figures 10–19. Figure 10 presents the
output of a parameter variation experiment that was conducted to determine the amount of fish needed
to have a maximum fish stocking density of 50 kg¨ m´3 per tank. Based on this parameterization the
average fish density could be determined (Figure 11). Figure 11 outlines the advantage of using several
fish tanks to avoid sharp fluctuations in fish biomass and thus feed input by use of a standing stock of
different size classes.
5.1. Fish Biomass Estimates
The DAPS model (see Figures A1–A4) outputs are shown in Figures 10–19. Figure 10 presents the
output of a parameter variation experiment that was conducted to determine the amount of fish needed
to have a maximum fish stocking density of 50 kg¨ m´3 per tank. Based on this parameterization the
average fish density could be determined (Figure 11). Figure 11 outlines the advantage of using several
fish tanks to avoid sharp fluctuations in fish biomass and thus feed input by use of a standing stock of
different size classes.
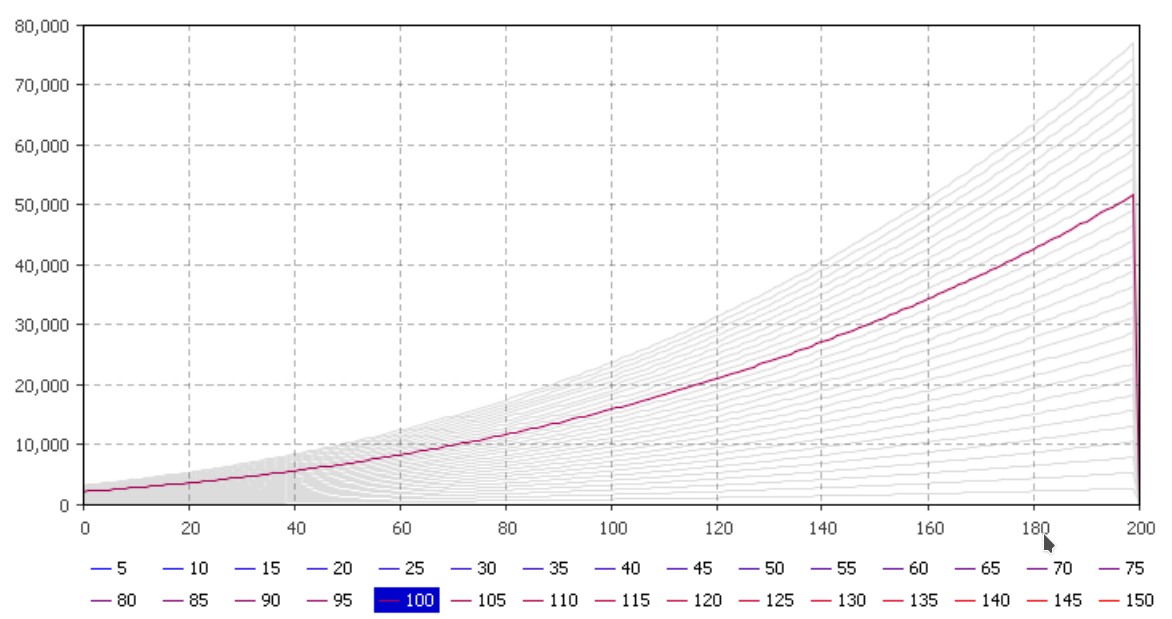
Figure 10. Outcome of a parameter variation experiment assessing the amount of required fish to
achieve a maximum stocking density (y-axis) of 50 kg¨ m´3 per tank. The days are displayed on the
x-axis. For this simulation, approximately 100 fish were needed to meet that objective.
achieve a maximum stocking density (y-axis) of 50 kg¨ m´3 per tank. The days are displayed on the
x-axis. For this simulation, approximately 100 fish were needed to meet that objective.
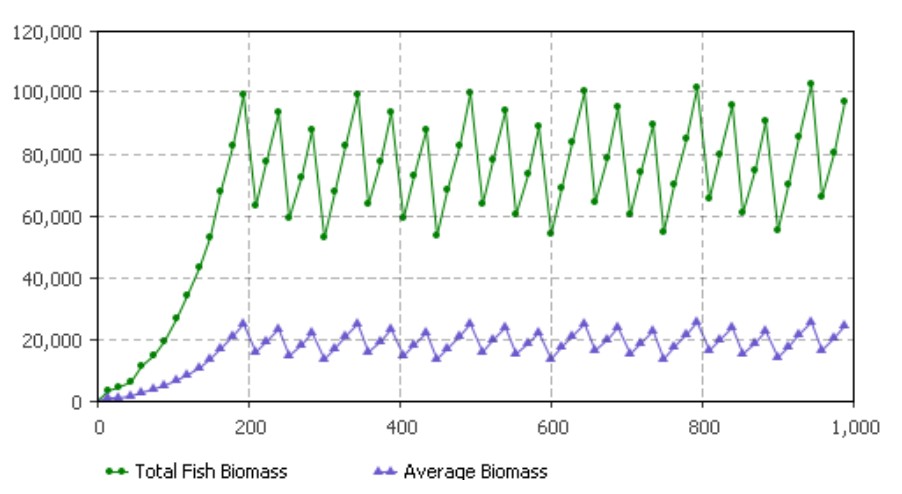
Figure 11. Average biomass per fish tank and total fish biomass of all fish tanks (in g; y-axis) in the
RAS for the first 1000 days (x-axis). Fish biomass peaks every 50 days corresponding to the proposed
harvest schedule.
RAS for the first 1000 days (x-axis). Fish biomass peaks every 50 days corresponding to the proposed
harvest schedule.
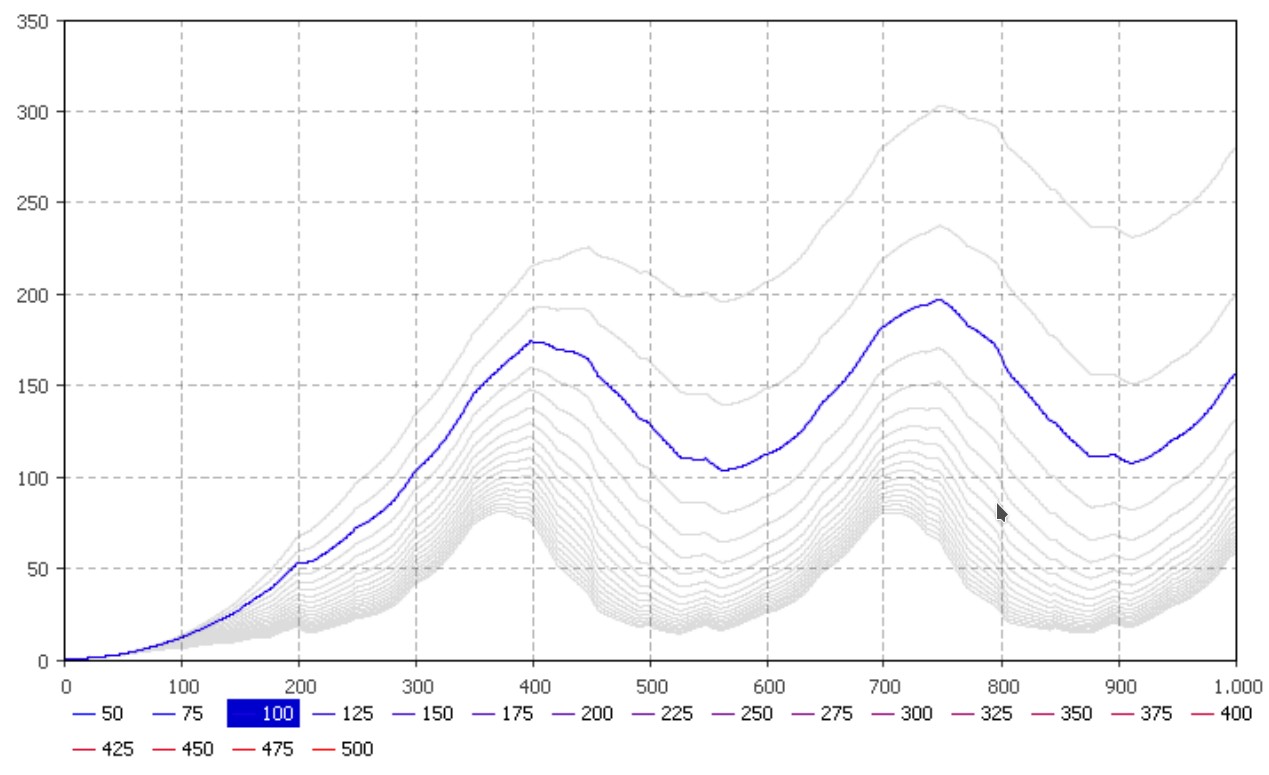
Figure 12. Parameter variation experiment estimating the RAS-derived N-NO3 concentration in mg/L
(y-axis) based on different cultivation area (m2
) options under natural light conditions. The days are
displayed on the x-axis. It can be seen that 200 mg/L N-NO3 are not exceeded, when having 100 m2
cultivation area
(y-axis) based on different cultivation area (m2
) options under natural light conditions. The days are
displayed on the x-axis. It can be seen that 200 mg/L N-NO3 are not exceeded, when having 100 m2
cultivation area
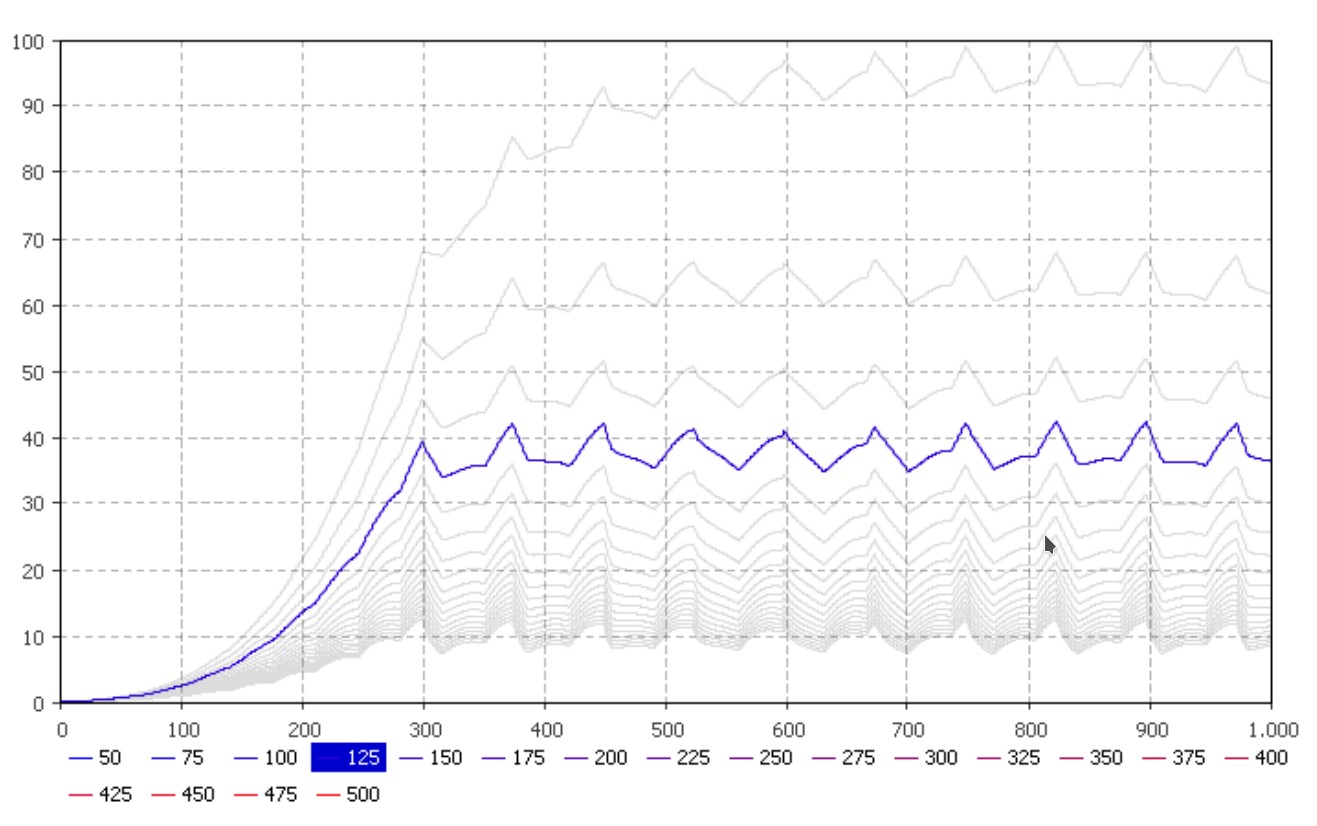
Figure 13. Parameter variation experiment for estimated N‐NO3 concentration (in mg/L) when using
different cultivation areas (in m2) Compared to the exclusive use of natural light, the application of
artificial light for industrial production shows a different picture. The y‐axis shows the RAS N‐NO3
concentration, whereas the x‐axis displays the days.
different cultivation areas (in m2) Compared to the exclusive use of natural light, the application of
artificial light for industrial production shows a different picture. The y‐axis shows the RAS N‐NO3
concentration, whereas the x‐axis displays the days.
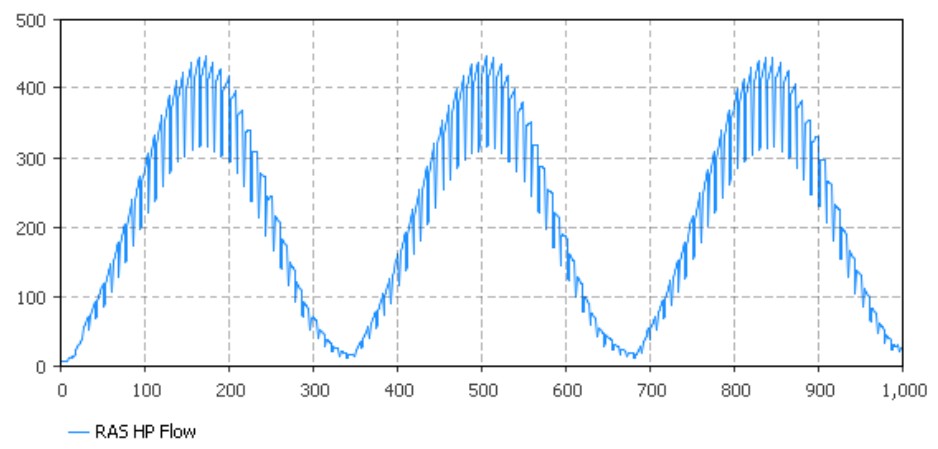
Figure 14. The evapotranspiration dependency for the water flow (in L; y-axis) from RAS to the
hydroponic component can be seen clearly in this figure showing the flow from the RAS to the
hydroponic component under natural light conditions. The days are displayed on the x-axis.
hydroponic component can be seen clearly in this figure showing the flow from the RAS to the
hydroponic component under natural light conditions. The days are displayed on the x-axis.
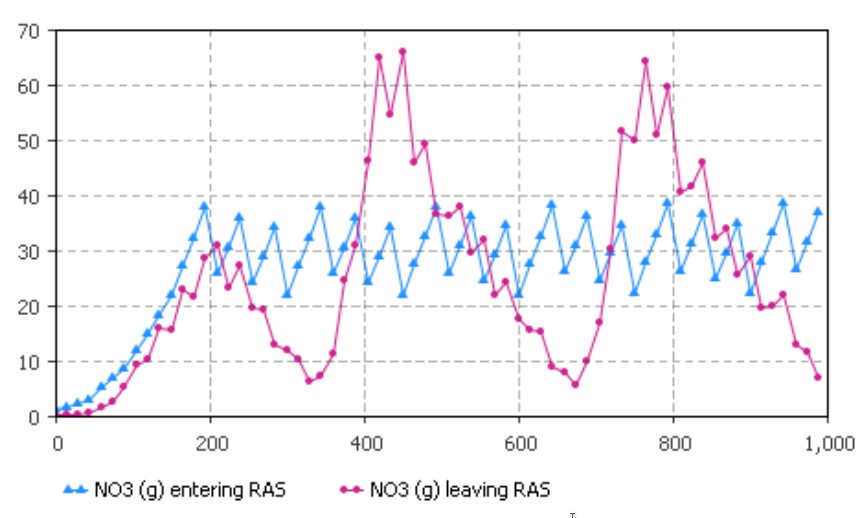
Figure 15. Dependent on the evapotranspiration rate (Figure 14), different nitrate flows from RAS to
the hydroponic component can be observed. The RAS nitrate balance in mg¨ L´1 (y-axis) for the first
1000 days (x-axis) can be seen using exclusively natural illumination and a cultivation area of 600 m2
.
the hydroponic component can be observed. The RAS nitrate balance in mg¨ L´1 (y-axis) for the first
1000 days (x-axis) can be seen using exclusively natural illumination and a cultivation area of 600 m2
.
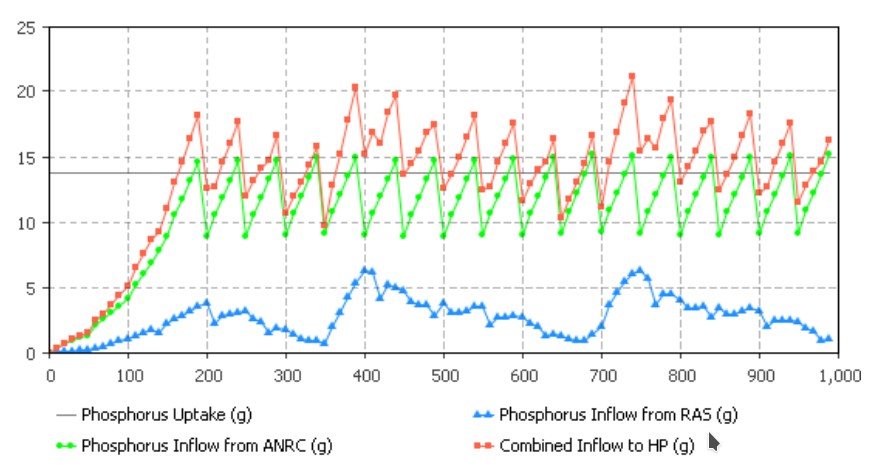
Figure 16. P dynamics in the hydroponic component with a cultivation area of 600 m2. The P lettuce
consumption (y-axis) is assumed being constant, although this is not the case. However, this does not
diminish the lettuces N total uptake. The days are displayed on the x-axis.
consumption (y-axis) is assumed being constant, although this is not the case. However, this does not
diminish the lettuces N total uptake. The days are displayed on the x-axis.
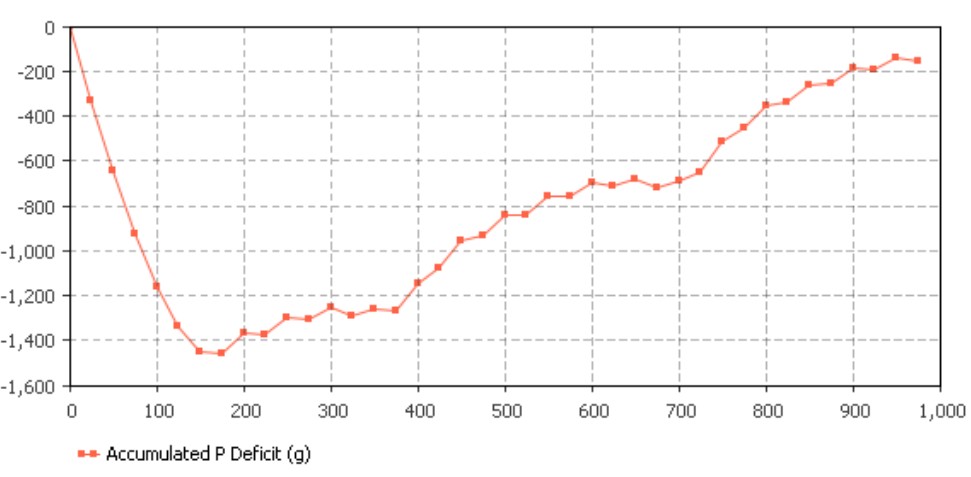
Figure 17. Accumulated P (y-axis) deficit in the system’s hydroponic component with a cultivation
area of 600 m2. After 1000 days (x-axis), the deficit is almost corrected.
area of 600 m2. After 1000 days (x-axis), the deficit is almost corrected.
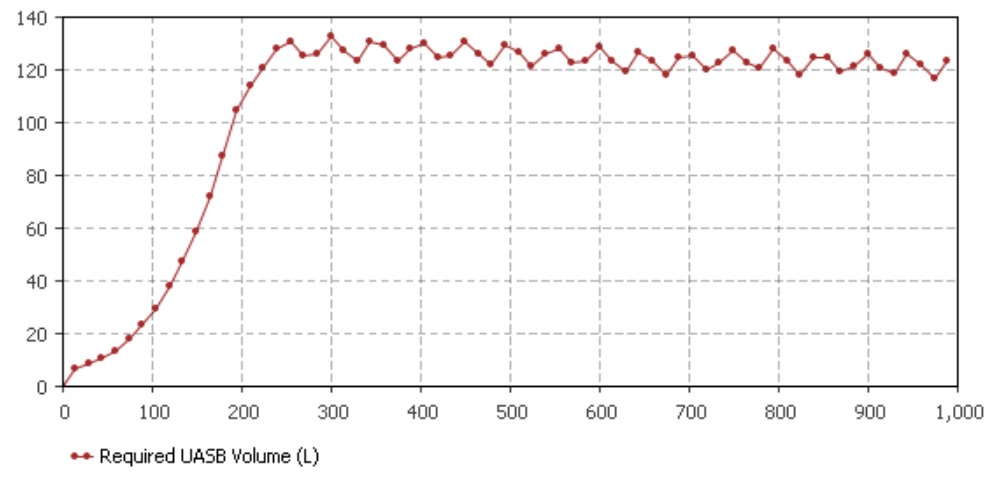
Figure 18. The required volume (L) of the UASB is dependent on the inflowing sludge, its SRT, and the
HRT. Here, we assume that the sludge blanket covers 60% of the UASB reactor’s volume. Thus, the
total filling capacity is around 140 L and serves as a good indication for sizing the reactor. The days are
displayed on the x-axis.
HRT. Here, we assume that the sludge blanket covers 60% of the UASB reactor’s volume. Thus, the
total filling capacity is around 140 L and serves as a good indication for sizing the reactor. The days are
displayed on the x-axis.
Add Comment